Infographics Toronto Real Estate Sales Stats May 2014
The stats are in for May 2014 Central Toronto. Since returning from my wedding and honeymoon (which was the best time of my life) I noticed that the House Market has slowed somewhat and becoming a little more balanced compared to earlier months of this year. Big reason for this is that there are more listings on the market therefore more options for buyers, decreasing bidding wars and high sale prices. Granted those still do happen, but not at the rate they were earlier this year. Sales prices are still up and volume as well, but we aren’t where we were even 2 months ago.
Condos on the other hand tend to be very localized by building, area and/or price range. For the most part, it is more of a buyers market, but there are exceptions for high demand buildings, floor plans, locations and price ranges. Some buyers are just waiting to jump on certain properties and this can create competition if two parties are interested resulting in the seller having the upper hand. Most cases a buyer will end up paying fair market value for a condo and both sides will be happy (in an ideal world). 🙂
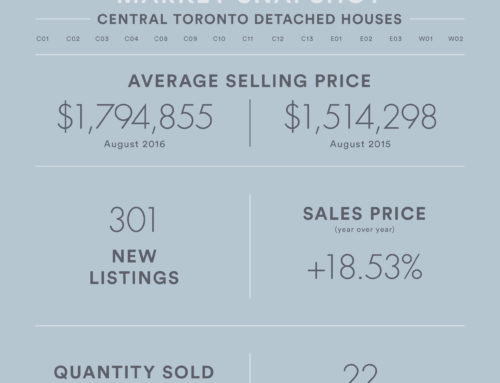
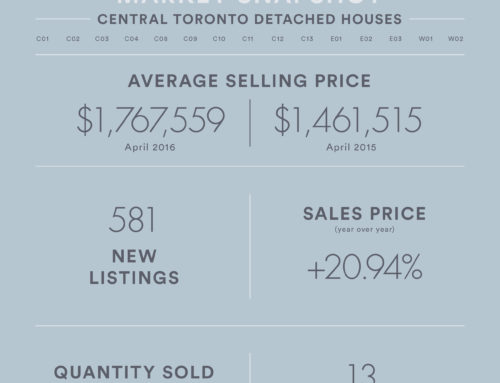
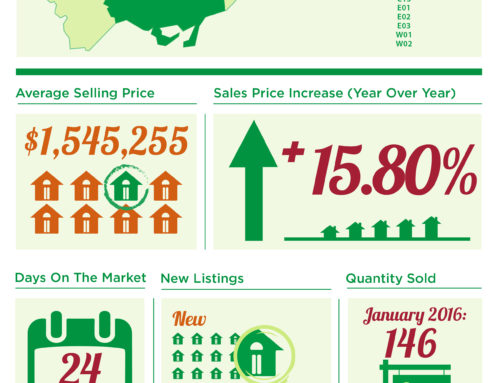
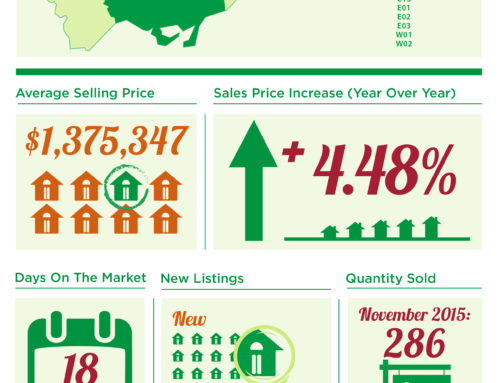
For May 2014, I’ll let my awesome infographics break down the stats for you.
Detached Houses
Semi/Row Houses
Condos
There you have it!
Contact david@davidspeedie.com for all your real estate needs. Thinking of Buying? Hit me up. Thinking of Selling? Hit me up. I have tons of experience in the Toronto Market and work very hard for all my clients.
If you have any questions you can also call/text me anytime 647 244 3931.
Have a great day and Let’s Go Blue Jays!


