State of the Market Infographics November 2015
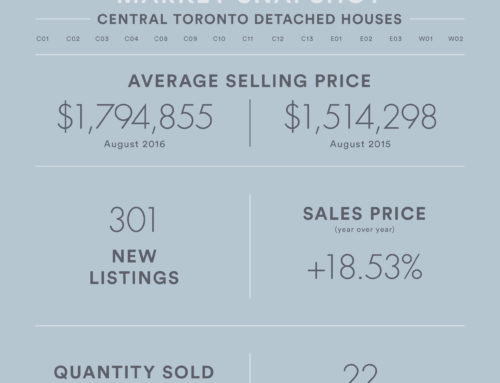
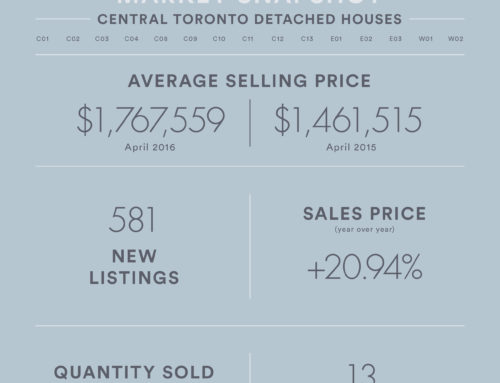
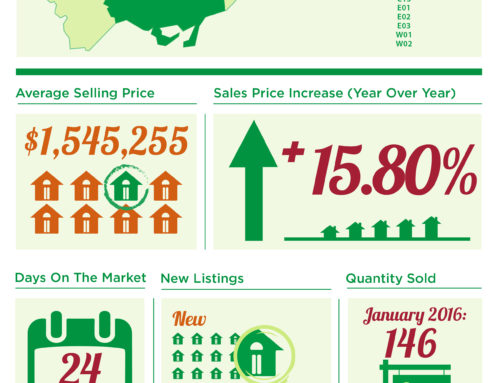
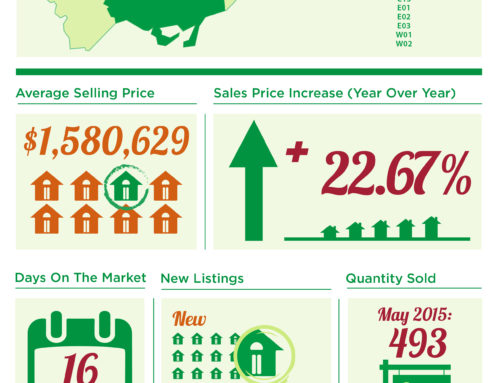
Another good month for the Toronto Real Estate Market. November tends to slow a bit compared to the previous two months, but as you can see strong market conditions continued through the month. These infographics help break it down into detached, semi/row houses and condos. State of the Market Infographics November 2015.
Central Toronto REALTORS® reported 1310 home sales through the Toronto MLS® in November 2015. It was also reported that on average homes sold for $753,151, they took 24 days to sell and sold for 100% of list price.
But what exactly is happening in your neighbourhood? I’ve broken down the sales activity by neighbourhood and provided detailed reports to give you a true sense of what’s happening in your local market. SIGN UP NOW!
I hate spam just as much as you do. I promise that your email address and contact information will not be shared, sold or abused.
I hope you enjoy this month’s reports and encourage you to ask me any questions that come to mind. If you have friends or family you think might be interested, please feel free to pass the reports on to them. I would appreciate it!
For all your real estate needs contact david@davidspeedie.com or text/call 647 244 3931. Get ready for 2016!
Detached
Semi/Row Houses
Condos


